~/guides/FORECAST.md
Install Google TimesFM with Claude Code and forecast your sales in two sentences (tested: 20-day total off by 1%)
Google's open TimesFM forecasts without training. Install its official skill in Claude Code, give it your CSV, get a forecast and a best-to-worst range.
How much will you sell next month? Answering that used to mean training your own model for weeks. Google's open-source TimesFM has already seen 100 billion real data points, so you can drop your data in and forecast right away. On 2 November 2026 I tested it on a real shop's revenue and checked its GitHub, its official skill and Google Research's write-up. This is the full version of my FORECAST reel: how to set it up with two sentences in Claude Code, how to forecast, how accurate it was, and the license catch.
01What you get
TimesFM (Time Series Foundation Model) is a time-series forecasting model from Google Research. Give it a series of dated numbers, like daily revenue, orders or followers, and it forecasts what comes next, with a best-to-worst range.
In this guide:
- The one sentence that installs TimesFM's official skill in Claude Code.
- The one sentence that reads your CSV and draws the forecast.
- How to check accuracy first (hide the last few days and let it guess).
- Our test numbers, and when to use version 2.5 or BigQuery.
02Sentence 1: install the official skill in Claude Code
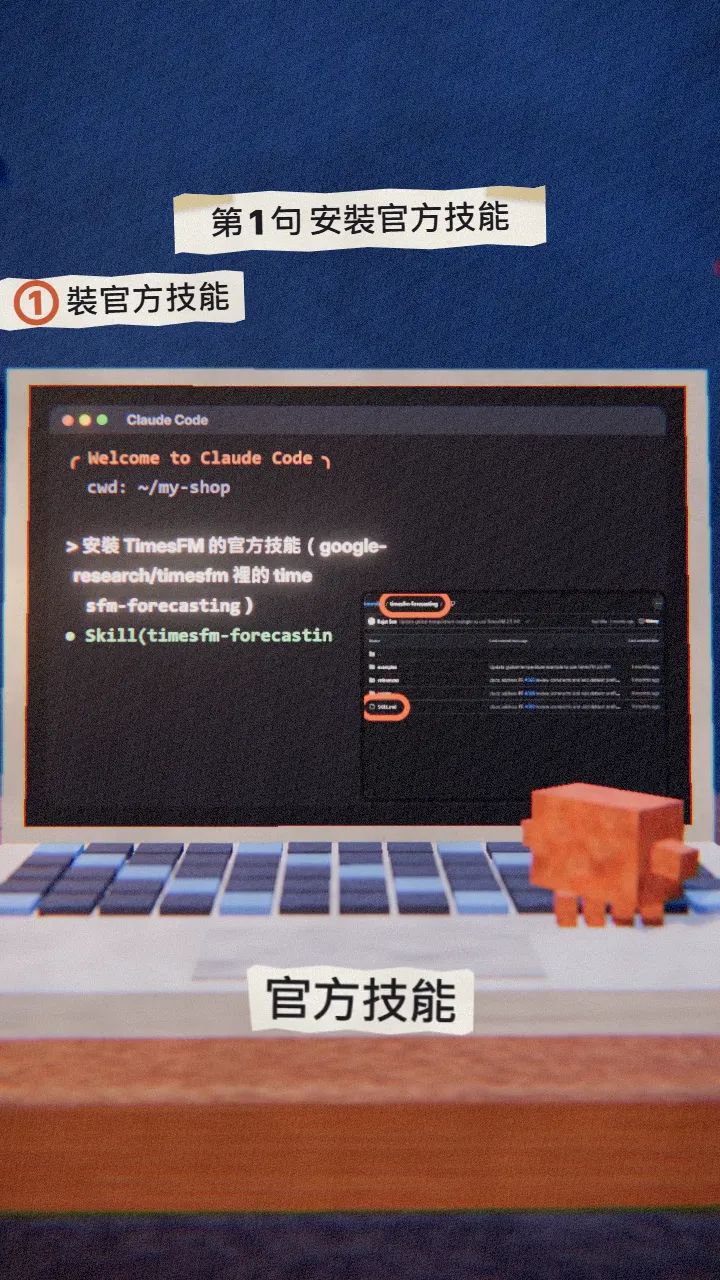
The TimesFM GitHub repo ships an official agent skill, timesfm-forecasting (Apache 2.0). It checks your RAM and disk before downloading the model, so you don't have to work out the install yourself. Open Claude Code and paste:
Install TimesFM's official skill timesfm-forecasting (in github.com/google-research/timesfm), run its system check first and tell me whether this computer can run it.
03Sentence 2: give it your sales and forecast next month
Prepare a CSV with one date column and one number column. Revenue, orders, site traffic or followers all work; the longer the history the better (at least a few dozen rows). Put it in the folder Claude Code is open in, then say:
Read [sales.csv], use TimesFM 2.5 to forecast [revenue] for the next [30 days], draw the 10%-90% range, save it as forecast.png and sum it up in one paragraph.
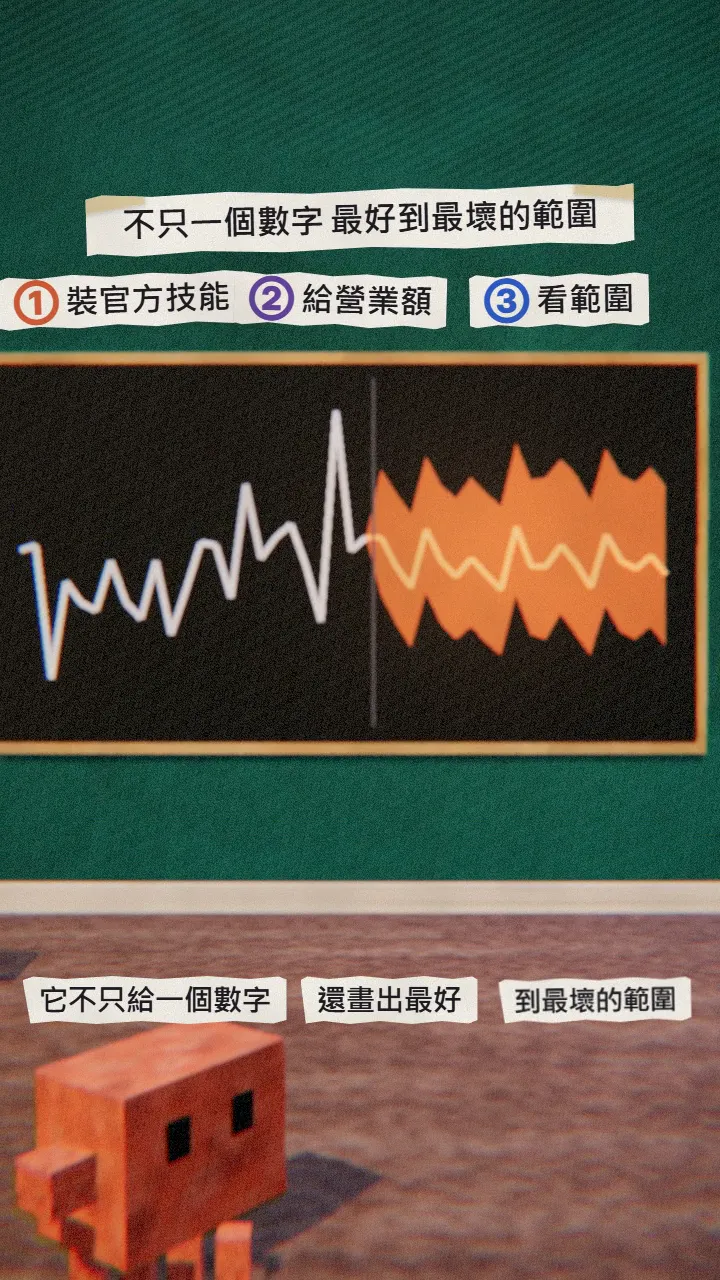
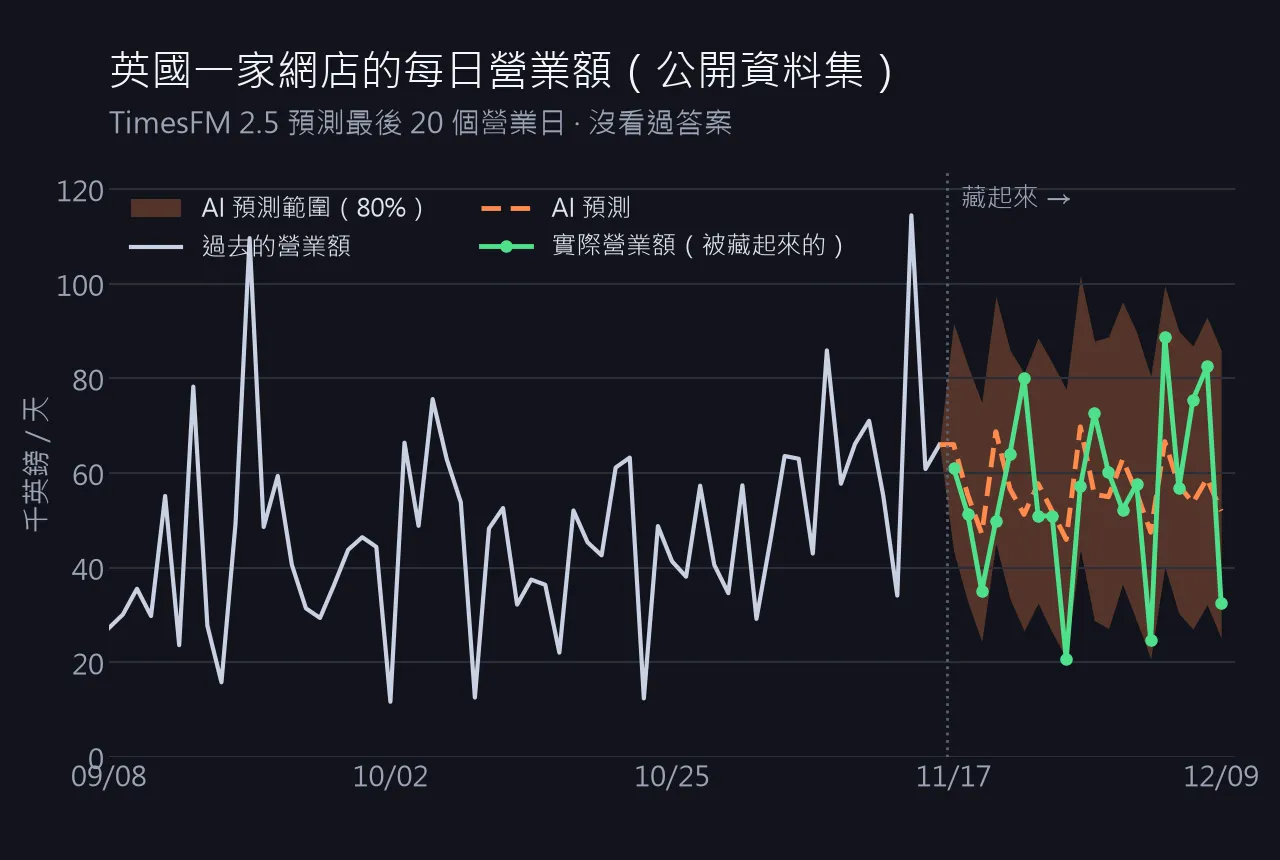
The range means: based on the patterns it learned, the real number has an 80% chance of landing inside the band. A wider band means more uncertainty, so leave more slack when you stock up or plan shifts.
04Check first: hide the last 20 days and let it guess
The simplest accuracy check is a backtest: hide your most recent stretch of data, let it forecast from the earlier data only, then compare with what really happened.
Hide the last [20] days of sales.csv, let TimesFM forecast those [20] days from the earlier data only, then compare with the real numbers: how far off the total is in %, and how many days fall inside the 10%-90% range. Draw it as one chart.
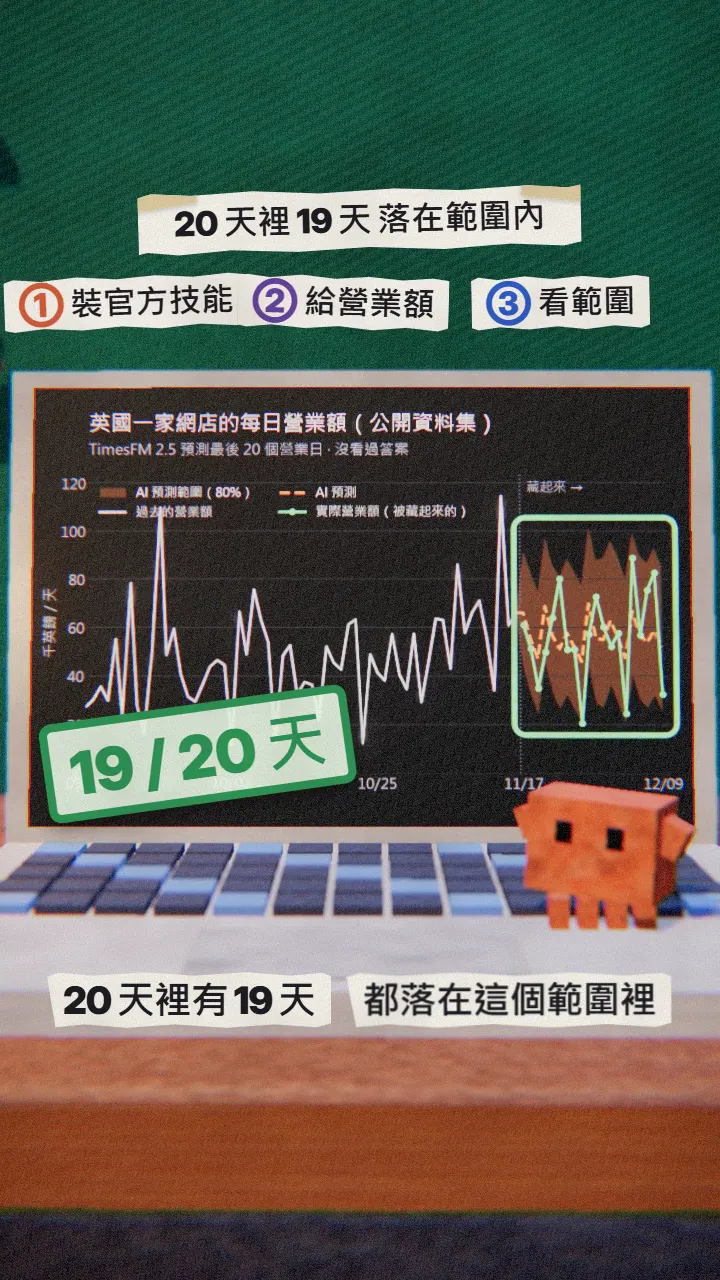
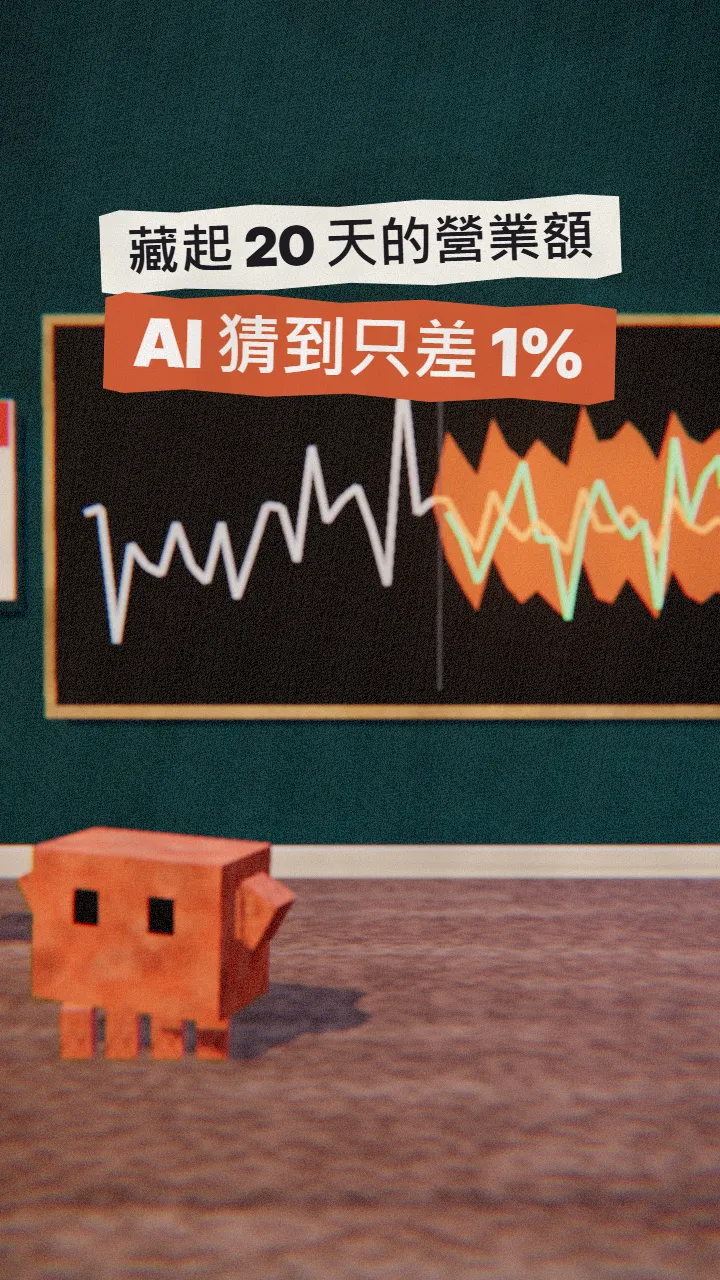
We used the UCI Online Retail public dataset: real transactions of a UK online shop from December 2010 to December 2011, summed to daily revenue (trading days only, cancellations removed). With the last 20 trading days (17 Nov - 9 Dec 2011) hidden, TimesFM 2.5 forecast a total of £1.135M against an actual £1.124M, off by 1.0%; 19 of 20 days fell inside the 10%-90% range.
05Rather not install it? Google Sheets and BigQuery
If your company's data already lives in Google BigQuery, you can use TimesFM directly in BigQuery ML, or use the forecast pane in Google Sheets' Connected Sheets (connected to BigQuery), without code. Both are Google Cloud services and are billed the Google Cloud way.
- GitHub: google-research/timesfm — source code and the official timesfm-forecasting skill
- TimesFM in BigQuery ML — Google Cloud
- Google Workspace update: forecast in Connected Sheets with TimesFM — 17 Feb 2026
06Watch out
- The code and the model weights up to version 2.5 are Apache 2.0 and can be used commercially. The newest 3.0 weights are for non-commercial, non-production use only; for business use of 3.0, Google points to Google Cloud services such as BigQuery ML. When you install it yourself with Claude Code, ask for version 2.5.
- The README says this open version is not an officially supported Google product.
- It only sees the pattern in your numbers. Promotions, holidays and price changes have to be fed in separately as covariates (the official skill has forecast_with_covariates), or it won't know about them.
- A forecast is a guide, not a promise. Before a big decision, backtest it on your own data.
- The forecast chart in the reel and in this guide is our own run; the terminal screens are illustrations.
Sources
- GitHub: google-research/timesfm (README, license notice, checked 2 Nov 2026)
- timesfm-forecasting official skill SKILL.md (checked 2 Nov 2026)
- Google Research: A decoder-only foundation model for time-series forecasting (100 billion time-points)
- Google Workspace Updates: Forecast data in Connected Sheets using BigQuery ML and TimesFM
- UCI Machine Learning Repository: Online Retail (test data)
What should the next reel cover?
I test Claude and AI tools every day and turn the useful ones into reels. Follow @vivianlin.tech to catch each new guide.